This guide breaks down how the two materials are made, how they perform, what they cost, and where each one wins — with sourced figures throughout so you can make a procurement decision instead of a guess.
Key Takeaways
- Natural graphite production generates roughly 2-6 kg of CO2 per kilogram, compared to 20-40 kg CO2/kg for synthetic graphite (LUH GmbH, 2026).
- Benchmark Mineral Intelligence's life-cycle assessments found natural graphite anodes run about 55% less carbon-intensive than the average Chinese-made synthetic anode.
- Natural graphite concentrate traded around $800-$1,200/t in 2025, versus $4,500-$6,500/t for battery-grade synthetic material (Mordor Intelligence).
- Synthetic graphite still holds the larger share of battery anodes today, but natural graphite is forecast to grow faster through 2031 on the back of cost and emissions advantages.
What's the Real Difference Between Natural and Synthetic Graphite?
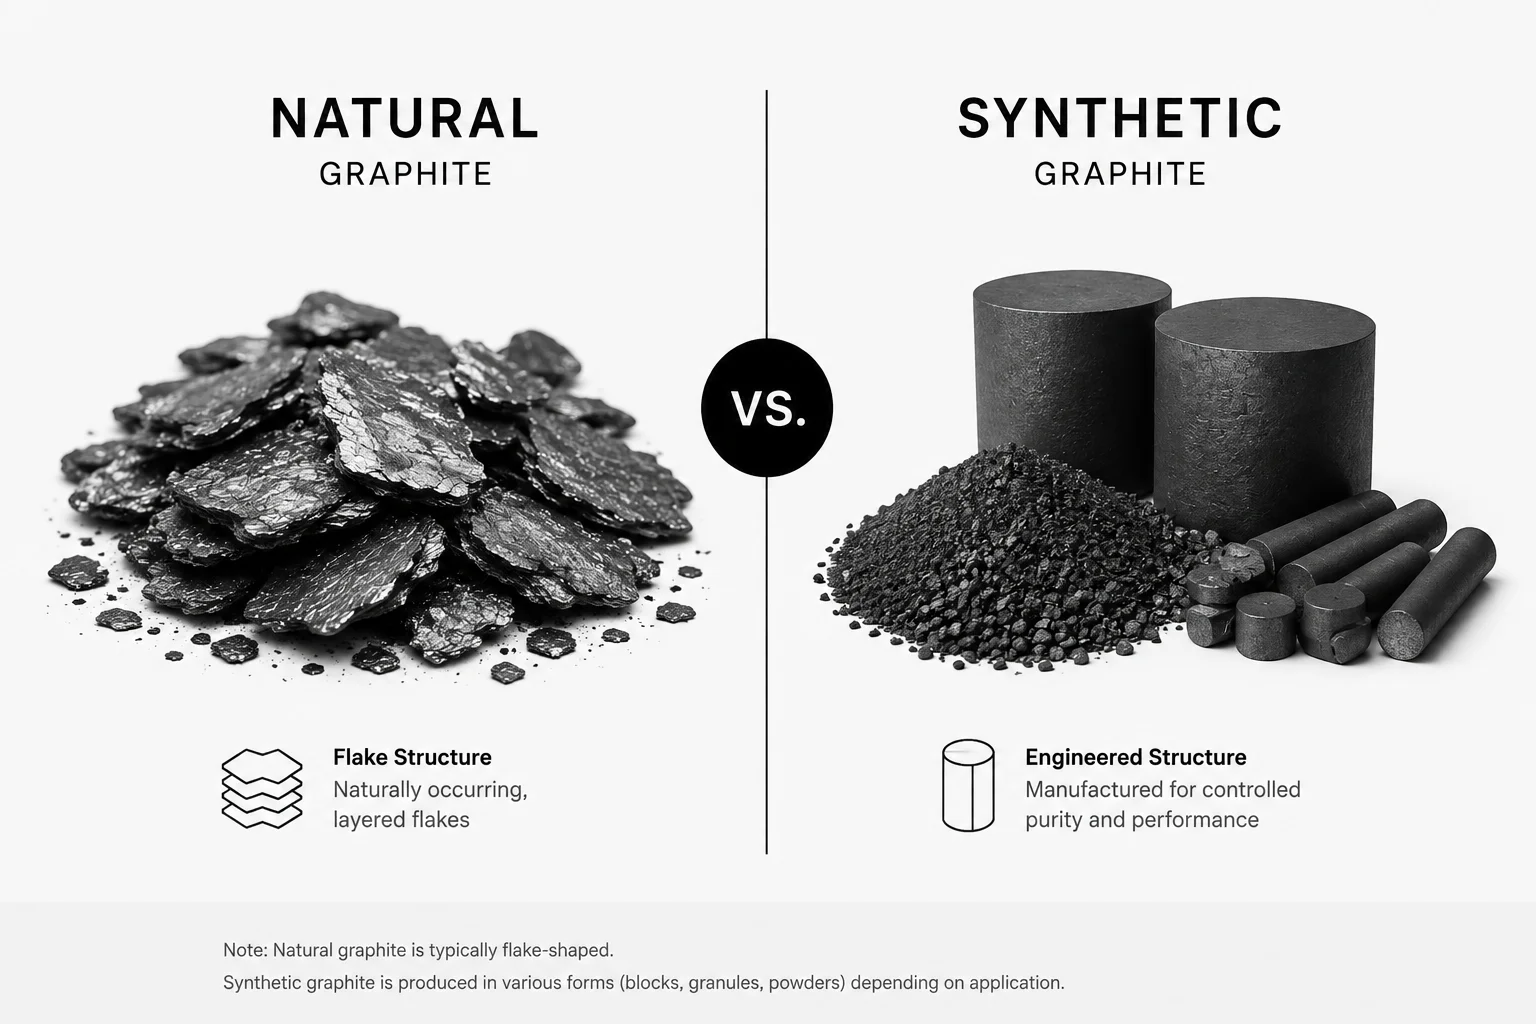
Natural graphite is a mineral. It's mined from flake, vein, or amorphous deposits, then washed, floated, and — for battery use — shaped into spherical particles and purified to over 99.9% carbon. Synthetic graphite is manufactured. It starts as calcined petroleum coke or coal-tar pitch and gets "graphitised" at temperatures above 2,000°C, a process that rearranges carbon atoms into a crystalline structure over several weeks.
That single distinction — dug up versus built up — explains almost every downstream difference between the two materials. Mining and purifying natural graphite is comparatively energy-light. Graphitisation is one of the most electricity-hungry steps in the entire battery supply chain, which is exactly why the emissions and cost gaps below are so wide.
Both materials end up chemically similar once refined: they're both over 99% elemental carbon. What differs is crystal structure, particle uniformity, and — critically — the process it took to get there.
Which Has the Lower Carbon Footprint?
Natural graphite wins here by a wide margin, and multiple independent studies back it up, not just producer marketing.
Industry comparisons put natural graphite production at around 2-6 kg of CO2 per kilogram, against 20-40 kg CO2/kg for synthetic graphite, depending on the energy mix used for graphitisation. Benchmark Mineral Intelligence's own life-cycle assessments arrived at a similar conclusion from a different angle: natural graphite anodes came in roughly 55% less carbon-intensive than the average synthetic anode produced in China.
Academic work tells the same story with different precision. A 2024 ACS Sustainable Chemistry & Engineering study of 12 operating and 22 planned Chinese synthetic graphite plants found an average carbon footprint of 9.0 tonnes of CO2 per tonne of synthetic graphite, ranging from 6.8 to 12.9 t/t depending on feedstock and energy efficiency. Separately, an EV manufacturer's own internal benchmarking cited by CarbonScape put synthetic graphite anode emissions as high as 25 tonnes CO2 per tonne, versus up to 14 tonnes CO2 per tonne for a natural graphite anode.
Why the spread between studies? Location matters enormously. Graphitisation running on a coal-heavy grid, like parts of Inner Mongolia, pushes emissions far above the global average — Minviro's research found coal-grid production can run 800-1,000% higher than commercial database benchmarks for both routes. For natural graphite, the dirtiest step isn't mining — it's spheroidisation, the mechanical rounding process that currently happens almost entirely in China and accounts for roughly two-thirds of natural graphite's own carbon footprint.
Cost Comparison: Why Natural Graphite Is Usually Cheaper
Price is where natural graphite's advantage becomes hardest to ignore. In 2025, natural graphite concentrate traded in the $800-$1,200 per tonne range, while battery-grade synthetic graphite ran $4,500-$6,500 per tonne — a four-to-six-fold gap. Anode-material pricing follows the same pattern: research from Germany's Öko-Institut put natural-graphite-based anode material at $4-$8 per kilogram versus $12-$13 per kilogram for synthetic anode material.
Where does that gap come from? Mostly electricity. Graphitisation furnaces run for weeks at temperatures that rival a blast furnace, and power is the single biggest line item in synthetic graphite's cost structure. Chinese producers have narrowed the gap by siting furnaces next to captive power and locking in long-term needle-coke contracts, but the structural cost advantage of mining over manufacturing hasn't gone away.
There's a catch, though. Cheap concentrate isn't the same as a cheap finished battery material. Turning flake into battery-grade spherical graphite involves significant yield loss — often only a third of the mined flake survives into finished spherical product — which erodes some of the raw cost advantage by the time natural graphite reaches a cell manufacturer.
Performance: Where Synthetic Graphite Still Has the Edge
Cost and emissions don't tell the whole story, and a fair comparison has to say so. Synthetic graphite's isotropic, highly uniform particle structure gives it real performance advantages in demanding applications:
- Fast charging — more consistent particle geometry supports quicker lithium-ion intercalation
- Cycle life — synthetic anodes generally tolerate more charge/discharge cycles before capacity fades
- Electrolyte compatibility — fewer surface defects mean less unwanted side reaction with the electrolyte
Natural graphite counters with higher theoretical capacity, lower first-cycle irreversible capacity loss in many formulations, and — as covered above — a meaningful cost and carbon edge. That's why most premium EV cell chemistries today blend the two rather than picking one exclusively, often weighting toward synthetic for range-focused NMC cells and natural for cost-focused LFP cells.
Is one "better" then? Not universally — it depends on whether the buyer is optimizing for charge speed, cost, emissions reporting, or supply security. That's a conversation worth having before locking in a spec.
Beyond Batteries: Industrial Applications Still Anchor Natural Graphite Demand
Batteries dominate the headlines, but they're not the whole market — and for natural graphite specifically, traditional industry still matters enormously. Refractories and foundry applications account for roughly 56-58% of natural graphite consumption, driven by magnesia-carbon and alumina-graphite linings that keep steel furnaces, ladles, and cement kilns intact at temperatures above 1,800°C.
Lubricants are the other long-standing use case. Natural graphite's layered crystal structure lets it shear cleanly under pressure, making it a go-to dry lubricant and friction modifier for high-temperature machinery, forging, and mechanical seals — jobs where synthetic graphite is rarely worth the added cost.
Synthetic graphite, meanwhile, still leads by volume overall: it held around 59-67% of total graphite market revenue in 2025 across all applications combined, largely on the strength of electric-arc-furnace electrodes and ultra-high-purity semiconductor and nuclear-grade material, categories where consistency matters more than cost. So while synthetic graphite dominates the biggest single market — battery anodes — natural graphite remains structurally essential across the rest of heavy industry, and that demand isn't going anywhere as global steel output keeps climbing.
Market Outlook: Where Natural Graphite Demand Is Headed Through 2035
The numbers here matter for anyone planning multi-year supply agreements. The global graphite market is projected to grow from roughly $18-22 billion in 2026 to somewhere between $28-46 billion by the early-to-mid 2030s, depending on the forecaster, at CAGRs generally in the 6-10% range. Natural flake graphite specifically is forecast to roughly double, from about 1.3 million tonnes in 2026 to 2.7 million tonnes by 2036 — a growth rate that outpaces every major battery raw material except lithium.
Segment-level forecasts diverge more sharply. One widely cited estimate has natural graphite expanding at a 12.29% CAGR through 2031, faster than synthetic graphite, on the strength of its cost advantage in refractories, lubricants, and expandable-graphite products. Even within batteries specifically, the natural graphite anode material market alone is projected to grow from about $1.87 billion in 2026 to $8.69 billion by 2035 — an 18.6% CAGR.
Supply concentration remains the wildcard. China currently accounts for roughly 70-80% of global natural graphite mining and controls an even larger share — often cited above 90% — of spherical graphite processing and anode manufacturing capacity. Diversification is underway: Mozambique, Madagascar, Tanzania, Canada, and Brazil are scaling up mine output, and European carbon border tariffs starting in 2026 are expected to make low-carbon, non-Chinese natural graphite more commercially attractive rather than less.
Natural vs Synthetic Graphite: Quick Comparison Table
| Factor | Natural Graphite | Synthetic Graphite |
|---|---|---|
| Source | Mined mineral, then purified/spheroidised | Manufactured from petroleum coke via graphitisation (2,000°C+) |
| Typical CO2 footprint | ~2-6 kg CO2/kg | ~20-40 kg CO2/kg |
| Typical concentrate price (2025) | $800-$1,200/t | $4,500-$6,500/t (battery grade) |
| Fast-charge performance | Good | Excellent |
| Cycle life | Good | Excellent |
| Best-fit applications | Refractories, lubricants, foundry, cost-sensitive LFP batteries | EAF electrodes, semiconductors, premium fast-charge cells |
| Supply concentration risk | High (mining + processing), diversifying | Very high (needle coke + energy-intensive processing) |
Which One Should You Choose?
If your priority is landed cost and a smaller carbon footprint — and your application can tolerate slightly less uniform particle geometry — natural graphite is usually the stronger default, especially for refractories, lubricants, foundry work, and cost-optimized LFP battery chemistries. If your priority is maximum fast-charge performance and cycle life regardless of premium, synthetic graphite still earns its higher price tag in NMC and high-performance cell design.
Increasingly, the honest answer for battery manufacturers is "both, blended in the right ratio for the chemistry." But for buyers weighing supply security and emissions reporting against a shrinking cost gap in performance, natural graphite's economics are only getting harder to overlook.
Frequently Asked Questions
Sources
LUH GmbH; Benchmark Mineral Intelligence; ACS Sustainable Chemistry & Engineering (2024); CarbonScape; Minviro/MINING.COM; Mordor Intelligence; IndexBox; Fairfield Market Research; DataM Intelligence; Öko-Institut/Visual Capitalist; International Energy Agency, Global Critical Minerals Outlook 2024.

With over 7 years of experience in graphite and graphene technologies, Puruvi leads corporate strategy, global collaborations, and product development across advanced carbon technologies. She has authored multiple technical guides on graphite sourcing, sustainability, and industrial applications.
Related Resources
Sourcing natural graphite for your application?
Contact PranaGraf Group today to discuss grades, request samples, or get help choosing between natural and synthetic material for your project.
Request Technical Consultation